

After the MIUI 12 upgrade, I just loved playing the new smooth animations 😍 and as a developer, was excited to know how to implement it 🤔.
The first thing I did was google "Wave Animation Can it be done in react-native? " 😬 and got a close result to what I was looking for but as I wanted to play with the wave. That wasn't enough and hence I tried further on my own.
Here are all my learnings compiled as an article.
1. Make A Smooth Curve
To draw a curve, we will use SVG Path which supports the cubic bezier curve.
A cubic bezier curve is a curve line formed using 4 points, a starting point, an ending point, and control points ( c1 & c2 ).
If you are familiar with making curves using SVG, you can jump 🏃🏻♂️ to point 2.
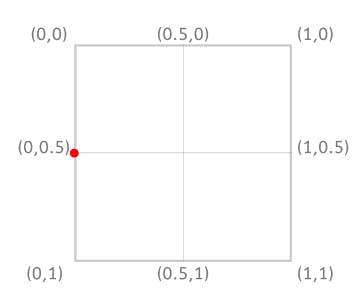
1.1 Let's Move To The Start Point 🎯
To move to a particular point in SVG, we use the "Move to" command i.e., M x y.
M 0 0.5
1.2 Make The 🧊 Cubic Curve
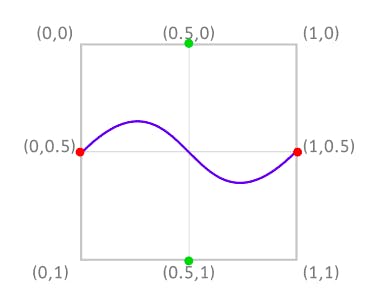
In the above example, we plot a curve that starts at (0, 0.5) and ends at (1, 0.5) with control points at (0.5, 0) and (0.5, 1).
🔴 Red dots are curve endpoints and 🟢 green dots are the control points.
1.3 Form A Closed Figure To Fill Color
To form a closed figure, we will draw lines connecting curve endpoints to (1, 1) and (0, 1).
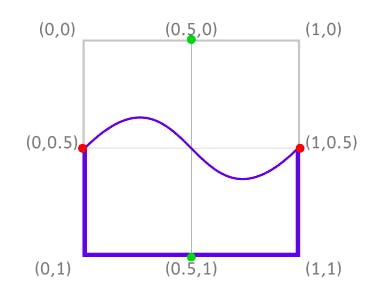
Hence, the complete path command is ⬇️
M 0 0.5 C 0.5 0 0.5 1 1 0.5 L 1 1 L 0 1 Z
const curveDimension = {
  start: { x: 0, y: 0.5 },
  c1: { x: 0.5, y: 0 },
  c2: { x: 0.5, y: 1 },
  end: { x: 1, y: 0.5 },
};
React Native code to make curve using SVG ⬇️ .
To understand how the bezier curve works check out this video. To learn more about SVG path format read this.
2. Get Device Orientation Values 📱
We will use expo-sensors's accelerometer to get the values.
Let's get the accelerometer (x,y,z) values and store them in the state variable orientation.
import { Accelerometer } from 'expo-sensors';
const Wave = () => {
 const [orientation, setOrientation] = useState({
    x: 0,
    y: 0,
    z: 0,
  });


 useEffect(() => {
    subscription.current = Accelerometer.addListener(({ x, y, z }) => {
      setOrientation(() => ({
        x: x,
        y: y,
        z: z,
      }));
    });
    return () => subscription.current.remove();
  }, []);
}
return <View><Text>{orientation.x}</Text></View>
}
Note: On tilting the phone left, the
orientation.xvalue becomes positive and vice versa when tilting right.
3. Moving the Curve on Phone Tilt
When a phone is tilted from the extreme left to the extreme right, the orientation.x value moves from a positive maximum to a negative maximum.
Accordingly, curve points coordinate move as shown below
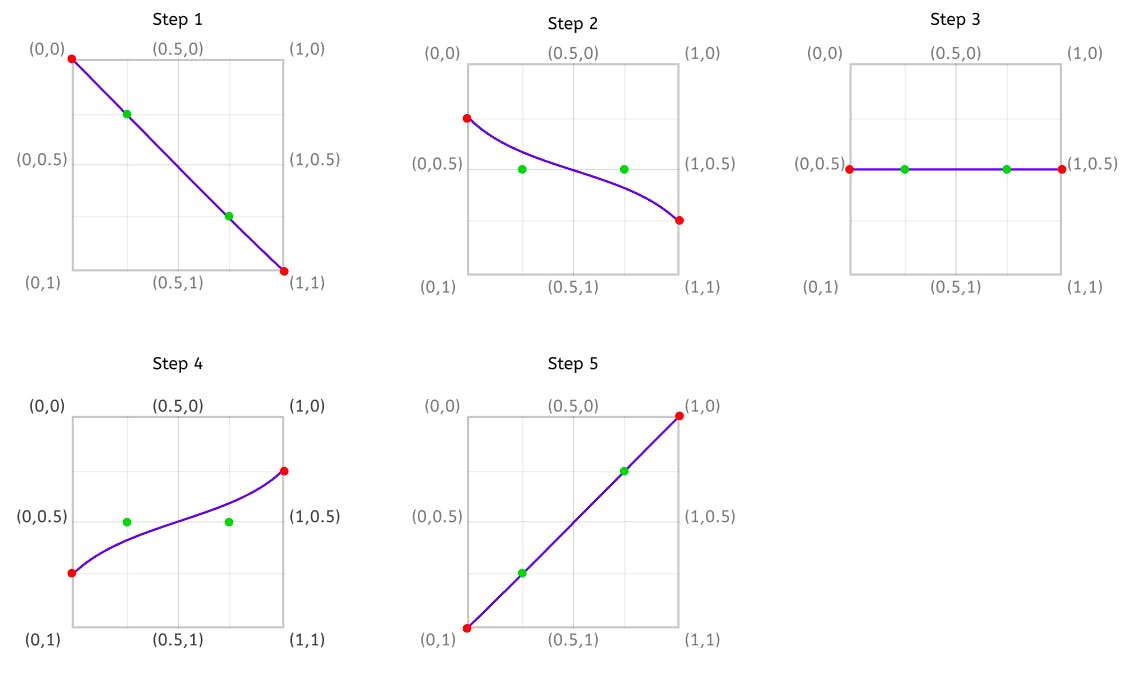
When you go through the above 5 steps, you can notice
The
startpoint will move from (0,0) to (0,1).The
endpoint will move from (1,1) to (1,0).Control points
c1moves from (0.25, 0.25) to (0.25, 0.75) andc2from (0.75,0.75) to (0.75, 0.25).
X coordinates for all the curve points are kept constant.
Let's find the relation of the Y coordinates of the curve points and the orientation.x value.
3.1 Start Point
We will find the relation between orientation.x and the start point. For that, we need to remember the below points.
When the phone is not tilted, the starting point stays at 0.5.
When titled right (negative
orientation.xvalue)startpoint increases from 0.5 till 1 and similarly 0.5 to 0 when titled left (positiveorientation.xvalue). Hence, we negate theorientation.xvalue.Initial position of the
startpoint is 0.5 when theorientation.xvalue is 0, so we will need to add 0.5 to theorientation.xvalue.
const adjustAxis = (value) => 0.5 + (-value / 1.5);
adjustAxis is a helper function to map orientation.x to the starting point's y value.
Hence, start.y = adjustAxis(orientation.x)
3.2 End Point
Since the end point is always opposite to the start point.
end.y = 1 - start.y
3.3 Start Control Point c1
After scratching the brain for a long 🤯, I came up with a linear equation that works fine for control points.
c1 = (start.y / 2) + 0.25
3.4 Ending Control Point c2
c2 = 1 - c1
🤫 Enough Talking, Let's Code It Down.
// start
const startY = adjustAxis(orientation.x);
// initial control point c1
const startControlPointY = (adjustAxis(orientation.x) / 2) + 0.25;
// curvePoints
const curveDimension = {
  start: { x: 0, y: startY},
   c1: { x: 0.4, y: startControlPointY},
   c2: { x: 0.6, y: 1 - startControlPointY},
   end: { x: 1, y: 1 - startY},
};
4. Let's Get Ready To Animate 🏋🏻♀️
As our curve points are derived from the startY and startControlPointY. We will make startY and startControlPointY as ** shared values ** and curve point as **derived value **.
Shared values can be understood as a replacement of
Animated.Valuewith more benefits.Derived values are similar to shared values whose value is derived from other shared values.
 const startY = useSharedValue(0);
 const startControlPointY = useSharedValue(0);
useSharedValue returns a reference to shared value initialized with the provided data. A reference is an object with .value property, that can be accessed and modified from worklets, but also updated directly from the main JS thread.
const curveDimension = useDerivedValue(() => {
    return {
      start: { x: 0, y: startY.value },
      c1: { x: 0.4, y: startControlPointY.value },
      c2: { x: 0.6, y: 1 - startControlPointY.value },
      end: { x: 1, y: 1 - startY.value },
    };
  });
useDerivedValue allows for creating shared value reference that can change in response to updating of one or more other shared values.
Create AnimatedPath
As we will animate values supplied in the SVGpath, let's first create an <AnimatedPath /> Component and replace it with <Path/>.
const AnimatedPath = Animated.createAnimatedComponent(Path);
animatedProps returns an object with key d and value as SVG path.
+ const animatedProps = useAnimatedProps(() => {
+   const { start, c1, c2, end } = curveDimension.value;
+   return {
+      d: `M ${start.x} ${start.y} C ${c1.x} ${c1.y} ${c2.x} ${c2.y} ${end.x} ${end.y} L 1 1 L 0 + 1 Z`,
+   };
+ });

- const staticPath = `M ${curveDimension.start.x} ${curveDimension.start.y}
- C ${curveDimension.c1.x} ${curveDimension.c1.y}
- ${curveDimension.c2.x} ${curveDimension.c2.y}
- ${curveDimension.end.x} ${curveDimension.end.y}
- L 1 1 L 0 1 Z`;
Supply animatedProps instead of the d.
- <Path
+ <AnimatedPath
      fill={'#0099ff'}
-    d={d}
+     animatedProps={animatedProps}
 />
5. Add Spring Animation
We are using spring animation because it gives control over velocity, stiffness, friction which can be used to give a fluid property to the curve.
 startY.value = withSpring(adjustAxis(orientation.x), {
    damping: 80,
    mass: 1,
    stiffness: 10,
    restDisplacementThreshold: 0.0001,
    restSpeedThreshold: 0.001,
  });

  const value = (adjustAxis(orientation.x) / 2) + 0.25;

  startControlPointY.value = withSpring(value, {
    easing: Easing.out(Easing.bounce),
  });
withSpring is a reanimated hook to implement string physics-based animation.
And finally, we are done. 🥳 🎊
This is how it looks ⬇️ .
To play with it in the expo app click here and if you are interested in improving it, check out the complete code.
Hope you enjoyed this article and learned something new. 🙇♂️
Also, check out William Candillon's Wave Animation Video if you haven't.